Helpful WPF tools: Pistachio, Snoop and Mole
- posted in:
- WPF
Every WPF developer should come across these three tools at some point in their career. These tools are extremely valuable for debugging, developing, cleaning and optimizing WPF applications. I can't believe how many months I went without using these tools to their full abilities, but now I use them on a daily basis. Below is a brief description of each tool along with links to where you can download them.
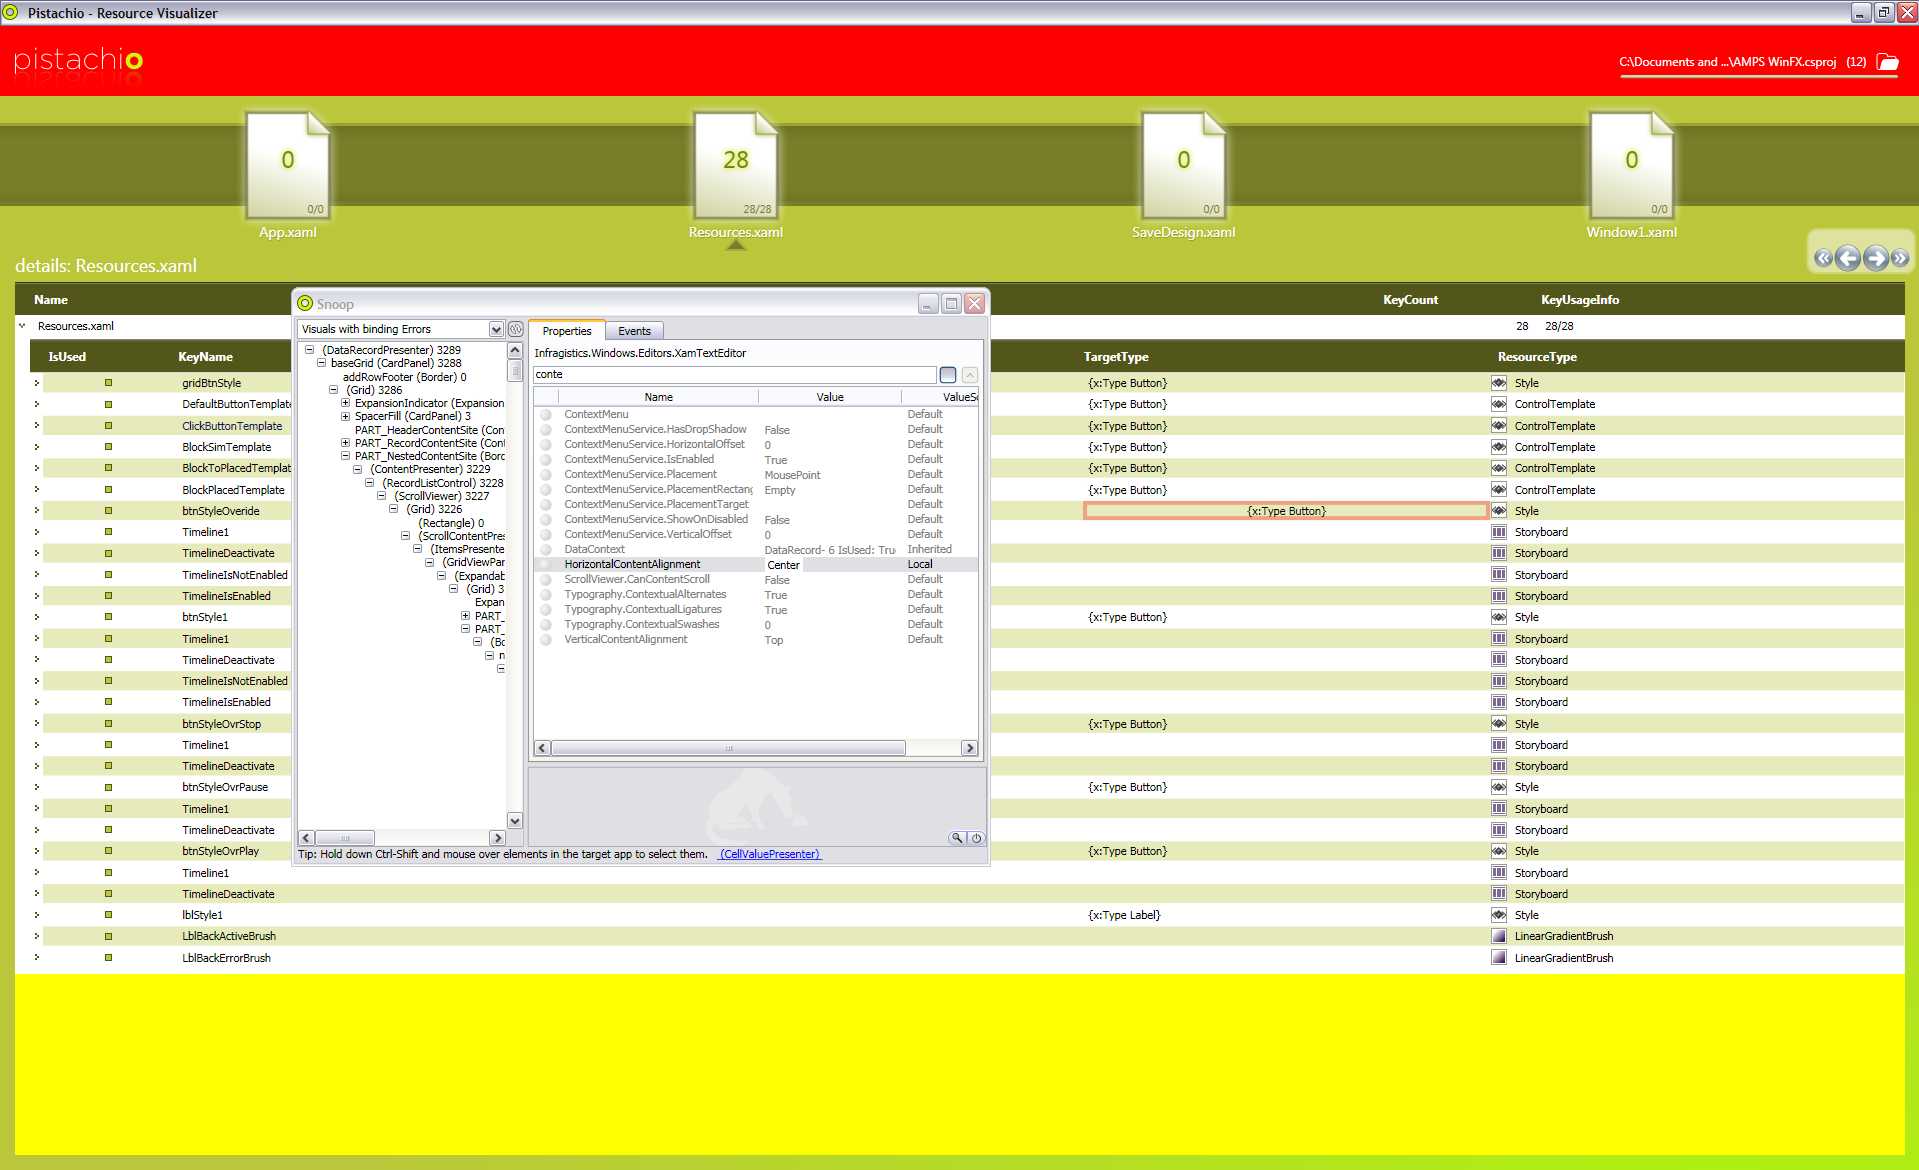
Pistachio

A WPF resource visualizer that allows you to open a project file (.csproj) and view all of the resources that you are using. It points out what files are using a particular resource and what line number it is on ... however it doesn't 'open' that file when the user clicks on the name of the file, even though a hyperlink-looking file name tells the user differently ... maybe this is something that will come out in a future update??? But nonetheless this is a great utility that one can step back from the inner workings of the project and see where all of your resources that you are using really live. I know I have cleaned up many resource files and in doing so improved the overall performance of my WPF apps. It also has some slick animations with their carousel and the design / colors of it are superb! Here's the site where you can download Pistachio:
http://www.granthinkson.com/2007/11/08/announcing-pistachio-wpf-resource-visualizer
and here's a direct link to the download:
http://www.granthinkson.com/wp-content/uploads/2007/11/pistachio.zip
Snoop
By far my favorite tool when debugging WPF apps, especially at a visual level, Snoop provides such a quick and efficient way to visually inspect my applications. Just run the .exe and tell snoop which WPF application to insepct. A window will pop up that stays on top of your application at all times (you can minimize it) and displays the visual tree on the left side (with the name of your elements, their type and how many children they contain) along with all of the properties and events on the right side. The properties tab shows all of the properties names, values and values' source of the selected visual item from the visual tree. Here you can inspect what values are on certain properties of particular elements and then change that value and watch as it changes in your application instantaneously!!! This is such a cool feature, and the change is persisted throughout the entire lifespan that your application is running as long as snoop is running. This is a great feature for changing colors, visibilities, sizes and many many other properties. You can also search for properties and even hold down ctrl-shift and mouse-over your application to instantly view what the visual element is. One note about the ctrl-shift is that snoop digs down into templates and usually down a layer or two more than what you are expecting, but that's a good thing, right? Of course it is, you can see what template that the visual element is receiving and if any of those values are being trumped by any local values.
Snoop also provides a nifty way to inspect visual data binding errors. In the upper left corner there is a drop down box that you can open and select 'Visuals with binding Errors' to see a list of visual data binding errors that your application has. This is a great tool to try to figure out why some binding expression may not be working. You can then select the property on the right side of the application and right-click to delve into the binding or binding expression for finer detail of the error. Also, when a property value changes the whole property's background changes to yellow for a second to grab the users attention.
One last nifty feature is that snoop allows you to view a list of events that you specify that occur in your application. You can see what elements are affected when you click on them and see who handles that click (if anyone) as well. Handled events are displayed in green. This is a great way to see the difference between tunneling and bubbling events and how they can affect your visual elements if they are handled too soon or not at all.
Here is the direct link and prettier pictures / more in depth on snoop's features:
However, snoop comes with full source and you must compile it first to use it. For the weary of heart you can download the compiled version with a little extra (an actual snoop icon!) at the bottom of the page. For some reason snoop never had an icon so I made one and used it in the project. The icon is also available for you to download.
Mole
Mole is the only evolving visualizer that I know of at this time. It looks very promising so far and will only get better. Mole has taken what snoop has to offer and gone beyond my expectations, with each new release surprising me even more. My only complaint about mole (and I understand that mole is a debugger visualizer) is that I can't use it how I can use snoop; a free standing application. You start mole from inside visual studio while at a breakpoint by clicking on the magnifying glass and selecting mole from your list of visual debuggers. That said, mole is worth the download and then some.
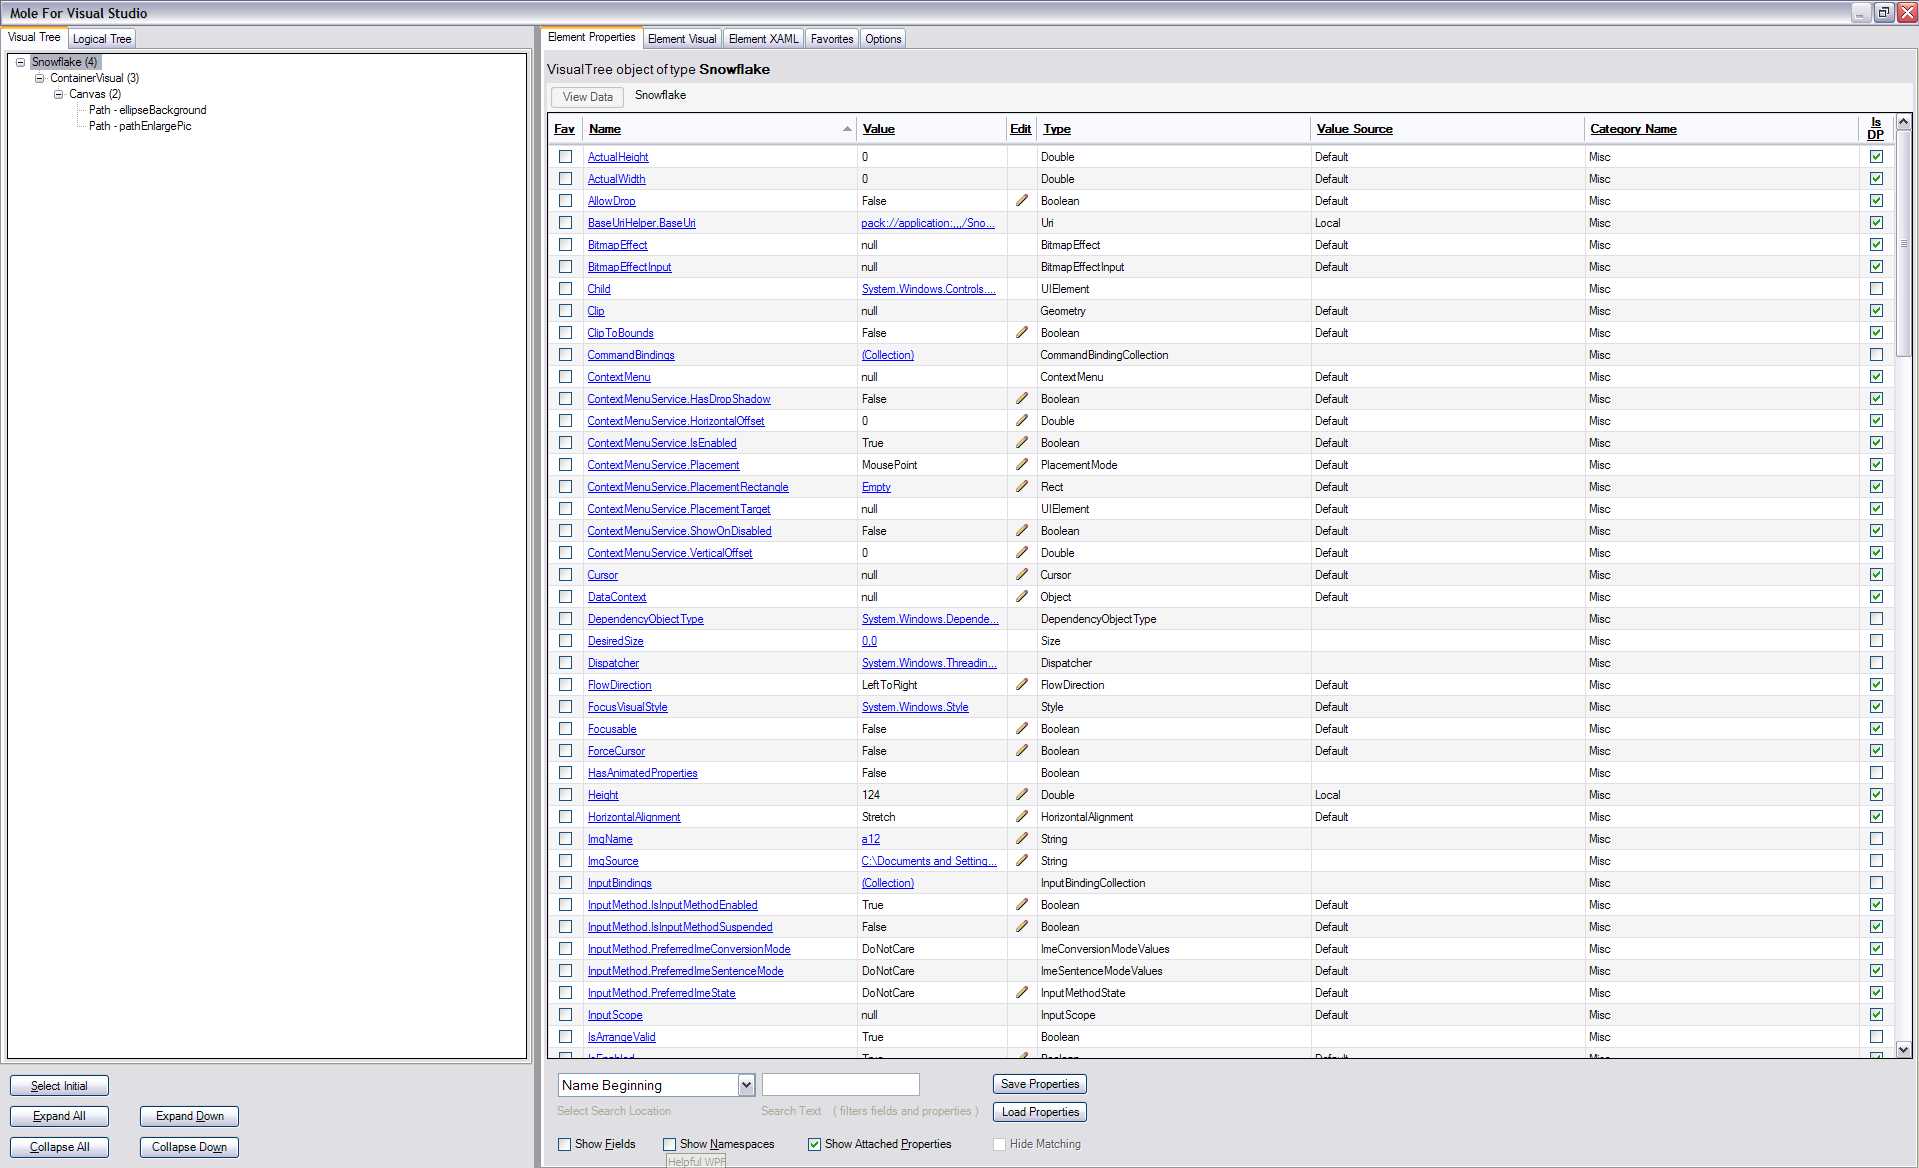
Mole offers the visual tree and the logical tree on the left much like snoop with a list of properties on the right. Mole offers a little more detail about the properties with more options to view certain groups that may interest you. You can also edit a property's value and have it be preserved throughout the applications life! You can look at a visual of that element, XAML code for that element (even if that visual was written in code), mark favorites and compare properties to each other from different runs of the program by saving the list of properties to an xml file.
Here is the codeproject site where you can download mole from; it continues to evolve so be sure to check back there for the latest!
If you have any other great WPF tools or just want to share your thoughts please do!
| file | file size |
|---|---|
| Snoop.zip | 61.73 KB |
| Snoop.ico | 3.55 KB |
Comments
Here's a useful technique for debugging/tracing triggers effectively. It allows you to log all trigger actions along with the element being acted upon:
Dan Lampingwww.wpfmentor.com/.../...iggers-using-trigger.html
Dear Matt,
KKwith scoop tool i tried to change the properties like height/width of the button/textbox controls of my wpf application, but they are not reflecting in the application at run time as you told... how to do it.. pls help..
Unfortunately the current version of snoop that is on Pete's site broke the property update ability ... you can search around for an older version of snoop that allows for property editing to work, but some of the new features are not present. I can post my old version if you are interested.
mattAlso, I just came across Dan's post where he has updated snoop with Pete's permission. I have not tried this out yet, but it looks very promising; he has a 32 and 64 bit version as well!!!
team.interknowlogy.com/.../...f-snoop-utility.aspx
Thank you very much for the guidance
KKCheck out the brand new WPF Inspector project. It's a visual debugging tool for WPF like Snoop, but includes also some other interesting features:
Christian Moser- DataBinding error analyzer/editor
- Trigger debugging
- Design rules checker
You can download it here:
http://www.wpftutorial.net/Inspector.html
Greetings
Christian